Melbourne's foodbowl
This map, released in 2019, shows agricultural production across Victoria, enabling stakeholders to investigate the significance of particular regions, including Melbourne’s foodbowl.
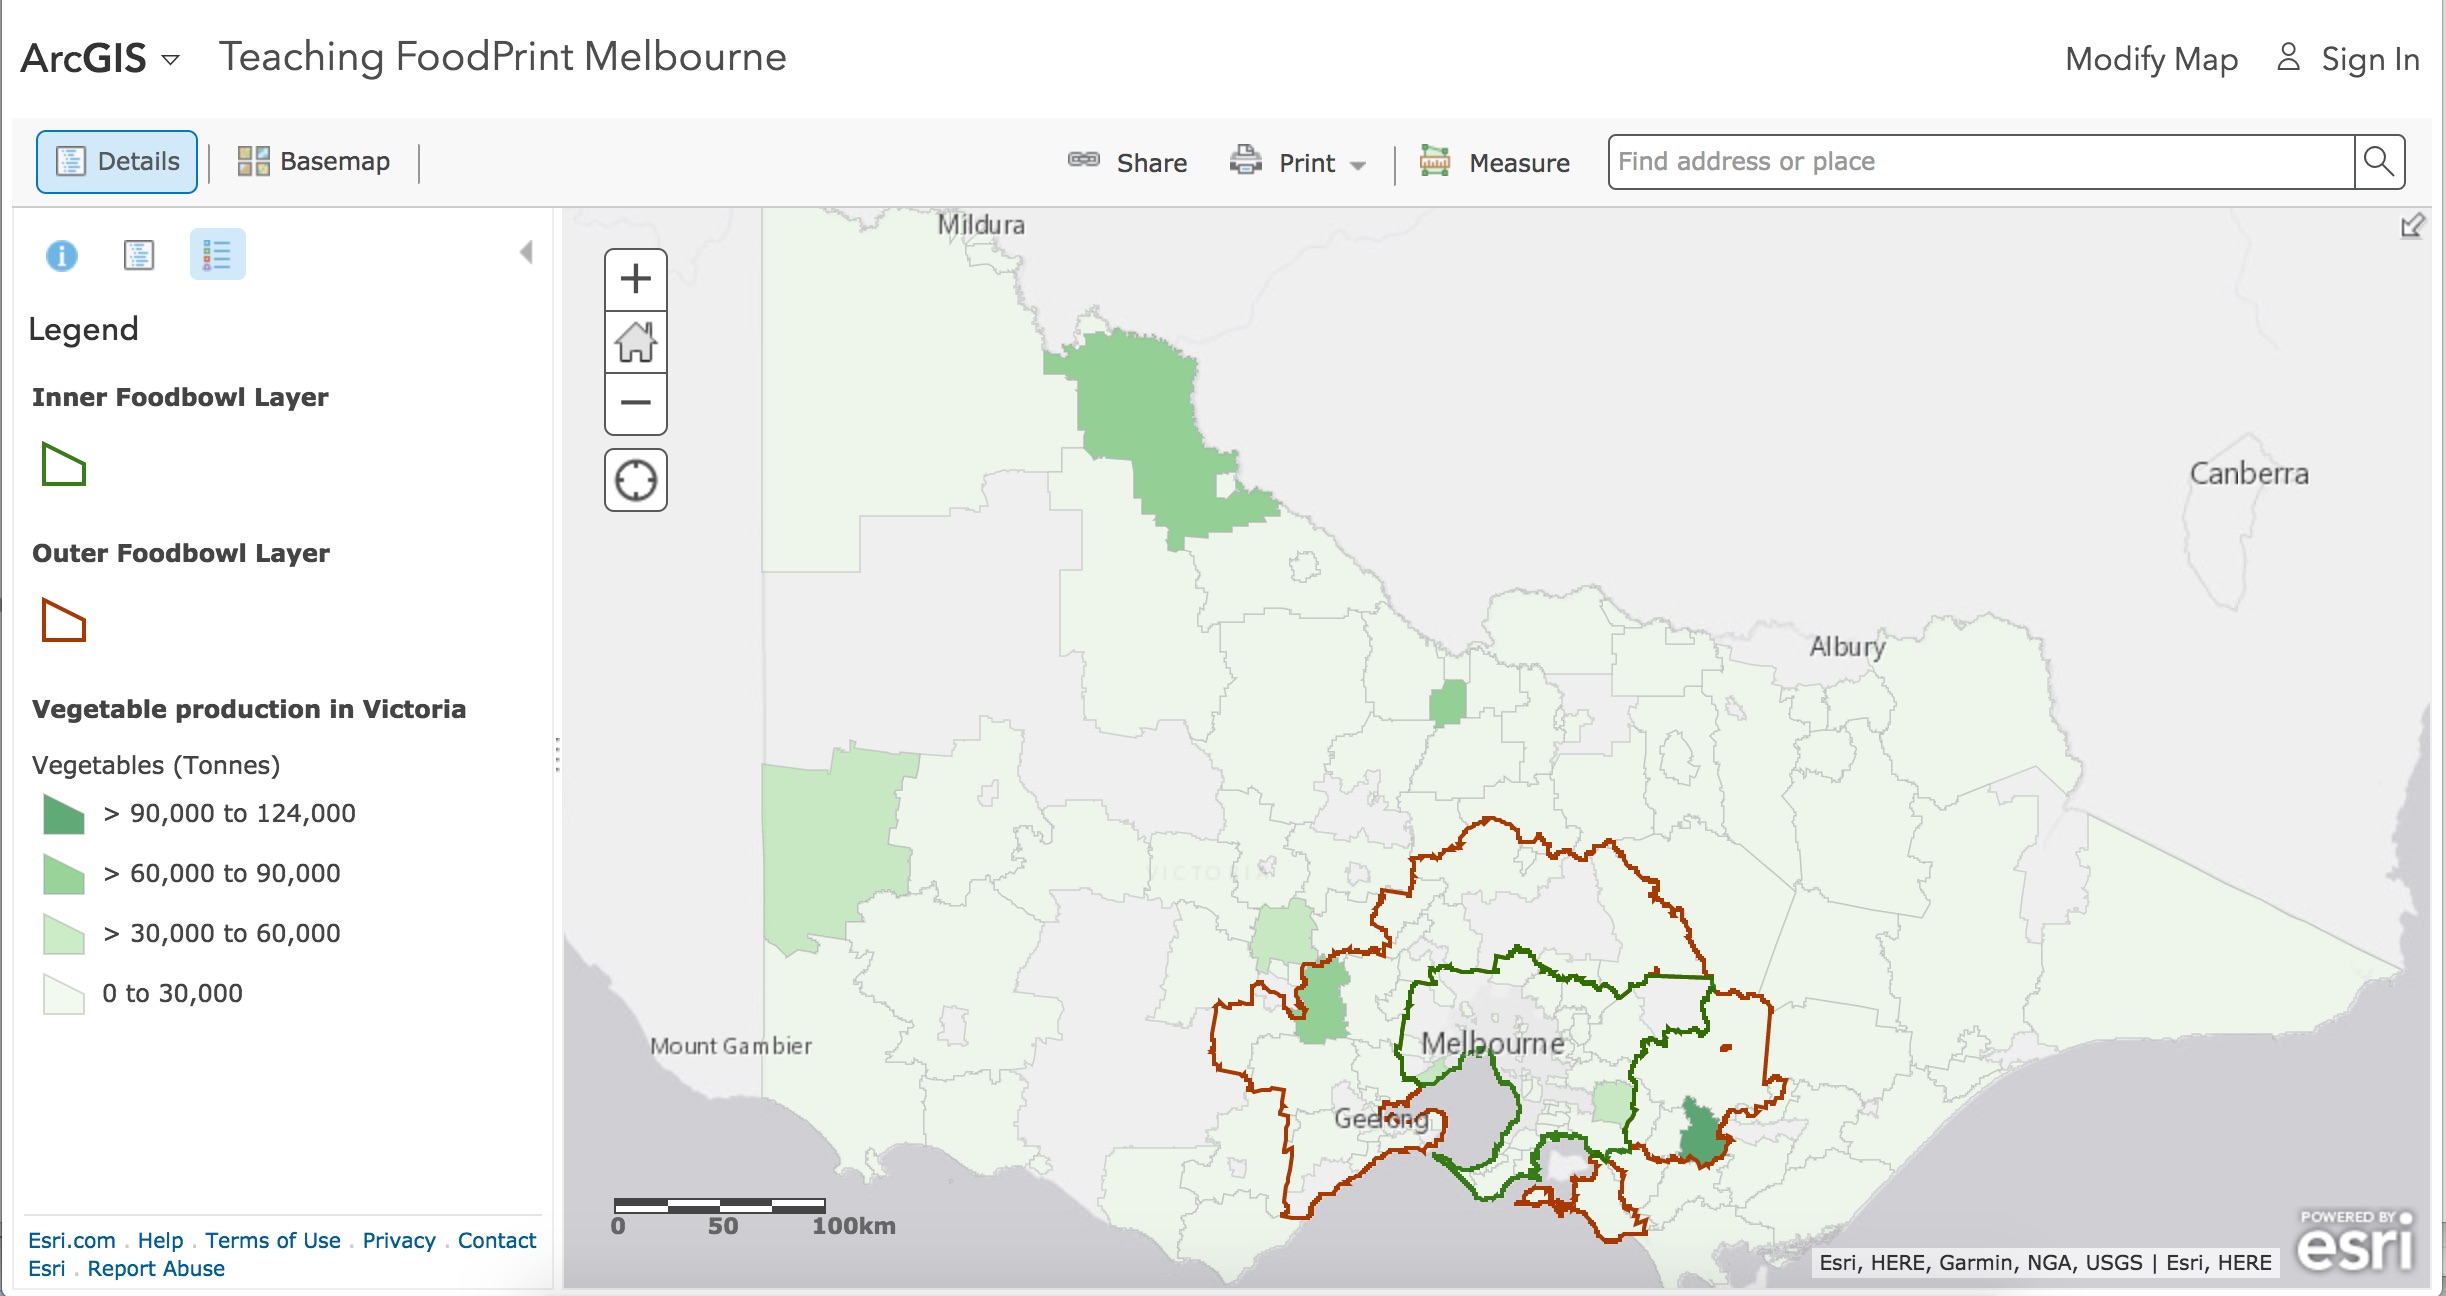
The Foodprint Melbourne project has developed an online GIS map that draws together data to help stakeholders understand what grows where in Melbourne's foodbowl and its distinctive characteristics.
The GIS map shows the quantities and percentage of the states’ crops that grow in Melbourne's foodbowl and elsewhere in Victoria, using Local Government Area (LGA) and Catchment Management Authority (CMA) boundaries. It also provides information about the relative availability of recycled water.
The resource has been designed to help stakeholders make strategic planning and policy decisions. There is also a simplified version of this GIS map designed as a teaching resource.
Sign up for the Foodprint Melbourne newsletter for project updates